
Search for the “best retirement annuity in South Africa” and you will quickly find rankings of providers, platforms and funds. The problem is that a retirement annuity is not one investment. It is a retirement-fund structure that can hold very different underlying portfolios — and those portfolios can produce very different outcomes.
The latest balanced-fund data makes that point particularly well. Using the South African Multi Asset High Equity peer group to 30 September 2026, Granate Balanced heads the three- and five-year comparisons, while ABAX Balanced leads the ten-year table when an appropriate retail class is used. The period matters, as does the share class. Meanwhile, Satrix Balanced Index ranks seventh over three years and eighth over ten years in the full Morningstar class universe.
That makes performance useful evidence, but a poor decision rule on its own. A sensible RA decision also considers costs, diversification, the manager and investment process, downside risk, Regulation 28, the time horizon and, most importantly, the role the RA needs to play in the wider retirement plan.
This guide explains both sides of that equation: why retirement an

- Key Definitions
- What is a retirement annuity?
- Tax benefits and the Two-Pot system
- Regulation 28 and balanced funds
- How we compared balanced-fund performance
- Top-performing balanced funds over 3 years
- Top-performing balanced funds over 5 years
- Top-performing balanced funds over 10 years
- How passive and core balanced funds compare
- Some well-known active funds in context
- What the performance tables really tell us
- How to evaluate funds inside an RA
- Where an RA fits into the wider retirement plan
- Frequently Asked Questions
- The bottom line
Key Definitions
Key Definitions
Retirement annuity (RA)
A retirement fund used by individuals to save for retirement. Contributions may qualify for a tax deduction; investments are subject to retirement-fund rules, including Regulation 28 and the Two-Pot system.
Regulation 28
The prudential framework for South African retirement funds. It includes a general 75% limit for listed equity exposure, while a separate 45% prudential foreign-exposure limit applies to pension funds.
ASISA South African Multi Asset High Equity
A peer category of diversified portfolios that typically hold significant growth assets. Many balanced funds used in retirement products belong to this category; inclusion does not itself prove that a fund is available or appropriate for every RA.
Annualised return
The compound average percentage return per year over a period longer than one year. It does not mean the fund earned that amount in every year.
Peer rank
A share class’s position among the Morningstar investments ranked in the same category and period. A rank of 7 / 210 means seventh out of 210 classes with a qualifying three-year record.
Share or fee class
Different versions of the same portfolio with potentially different fee structures and reported returns. Our top-five tables show each underlying strategy once and favour a more representative retail class where multiple classes appear.
What is a retirement annuity?
A retirement annuity is best understood as a structure rather than a single investment. You contribute money to a retirement fund, which invests it in one or more underlying portfolios that comply with applicable retirement-fund rules.
Two investors can both say that they have an “RA” while owning very different investments. One might use a low-cost index-oriented balanced fund; another might combine several active managers. Their providers, asset allocations, charges and investment results can all differ.
For someone without an employer retirement fund, an RA can be a principal vehicle for retirement saving. For someone already contributing to a pension or provident fund, it may provide supplementary saving capacity. Whether additional contributions are sensible depends on the wider plan, not just the deduction.
Tax benefits and the Two-Pot system
Retirement annuities have important structural tax advantages. For the 2026/27 South African tax year, qualifying contributions to pension, provident and retirement annuity funds are generally deductible up to 27.5% of the greater of remuneration or taxable income, subject to a R430,000 annual cap and the full section 11F calculation. The limit applies across qualifying retirement-fund contributions; it is not a separate R430,000 allowance for each RA.
Contributions that cannot be deducted immediately may generally be carried forward, subject to the detailed rules. Investment growth in the fund does not incur the same ongoing personal income-tax, dividend-tax and capital-gains-tax treatment as many directly held investments, although retirement benefits are taxed under the retirement-fund rules.
The Two-Pot system
Since 1 September 2024, new contributions are generally allocated one-third to a savings component and two-thirds to a retirement component. The savings component permits limited qualifying withdrawals before retirement, which are generally taxed at the member’s marginal income-tax rate. Any amount withdrawn also loses its future opportunity to compound.
Rights built up before the reform can sit in a vested component with different rules. It is therefore no longer accurate to say that no RA savings can ever be accessed before age 55. For the 2026/27 tax year, the threshold under which compulsory annuitisation is not required increased to R360,000. Retirement choices still depend on the components, vested rights and other statutory rules.
For more on access and the implications of withdrawal, read our Two-Pot retirement system guide.
Regulation 28 and why balanced funds feature so prominently
Retirement annuities do not offer unrestricted asset allocation. Regulation 28 imposes prudential investment limits intended to limit excessive exposure to particular assets and risks. Listed equity exposure is generally limited to 75%, while the separate prudential foreign-exposure limit applicable to pension funds is 45%.
Within these boundaries, managers still have considerable flexibility: they can take different positions in South African and offshore shares, bonds, cash, property and asset-allocation decisions. That is why funds in the South African Multi Asset High Equity category make a useful peer comparison — but being in the category does not mean every fund has the same risk profile or is available on every RA platform.
Nor does it mean every long-term RA investor should use the highest-equity balanced portfolio. Horizon, capacity for loss, existing retirement assets and the job that the capital must perform all matter.
How we compared balanced-fund performance
The tables below use the Morningstar data, with returns measured to 30 September 2026.
- Peer category: (ASISA) South African MA High Equity
- Three-year universe: 210 ranked share classes
- Five-year universe: 191 ranked share classes
- Ten-year universe: 136 ranked share classes
- Return basis: compound annualised percentage return, reported by Morningstar for the particular fund class, in fund base currency (rand for the selected South African funds)
One underlying fund can appear repeatedly because it has different fee or unit classes. We therefore show each underlying strategy only once in the top-five tables, using a more representative retail or higher-cost class where multiple versions of the same strategy appear. The Morningstar peer rank remains the unadjusted raw class rank, so gaps are intentional. The peer-group count is also not reduced after our de-duplication.
These are fund-class returns, not all-in investor outcomes. Class expenses and fee arrangements affect the reported series; extra platform, administration and financial-advice fees may apply outside the fund class. The export does not establish availability on every RA platform, and we have not adjusted the figures for a particular investor’s tax position or cash flows.
Rankings are historical. They are neither forecasts nor a reason to switch investments simply because the order has changed.
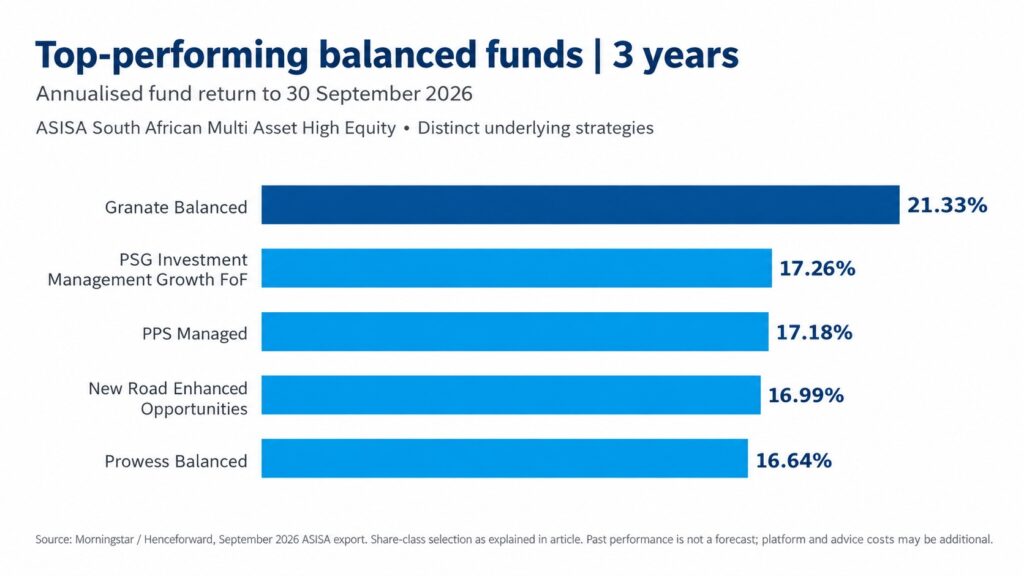
Top-performing balanced funds over 3 years to 30 September 2026
| De-duplicated rank | Fund | 3-year annualised return | Morningstar peer rank |
|---|---|---|---|
| 1 | Granate Balanced | 21.33% p.a. | 1 / 210 |
| 2 | PSG Investment Management Growth FoF | 17.26% p.a. | 2 / 210 |
| 3 | PPS Managed | 17.18% p.a. | 3 / 210 |
| 4 | New Road Enhanced Opportunities | 16.99% p.a. | 4 / 210 |
| 5 | Prowess Balanced | 16.64% p.a. | 5 / 210 |
Granate Balanced leads the three-year group at 21.33% p.a. Among the five distinct portfolios shown here, the return range is more than 4.6 percentage points a year. PSG Investment Management Growth FoF and PPS Managed follow, with New Road Enhanced Opportunities and Prowess Balanced completing the de-duplicated top five.
These latter two names are a reminder that a multi-asset peer category covers more than funds with “Balanced” in the title. All five were classified in the same ASISA high-equity category in this export; that is not the same as confirming the investment is offered in every retirement annuity.
Three years can favour a particular investment style or market environment. A high ranking is an invitation to examine the investment process and risk, not proof of future leadership.
Top-performing balanced funds over 5 years to 30 September 2026
| De-duplicated rank | Fund | 5-year annualised return | Morningstar peer rank |
|---|---|---|---|
| 1 | Granate Balanced | 16.28% p.a. | 1 / 191 |
| 2 | ABAX Balanced | 14.92% p.a. | 2 / 191 |
| 3 | Edgestone Prime Growth | 14.86% p.a. | 3 / 191 |
| 4 | PSG Investment Management Growth FoF | 14.72% p.a. | 4 / 191 |
| 5 | PSG Balanced | 14.66% p.a. | 5 / 191 |
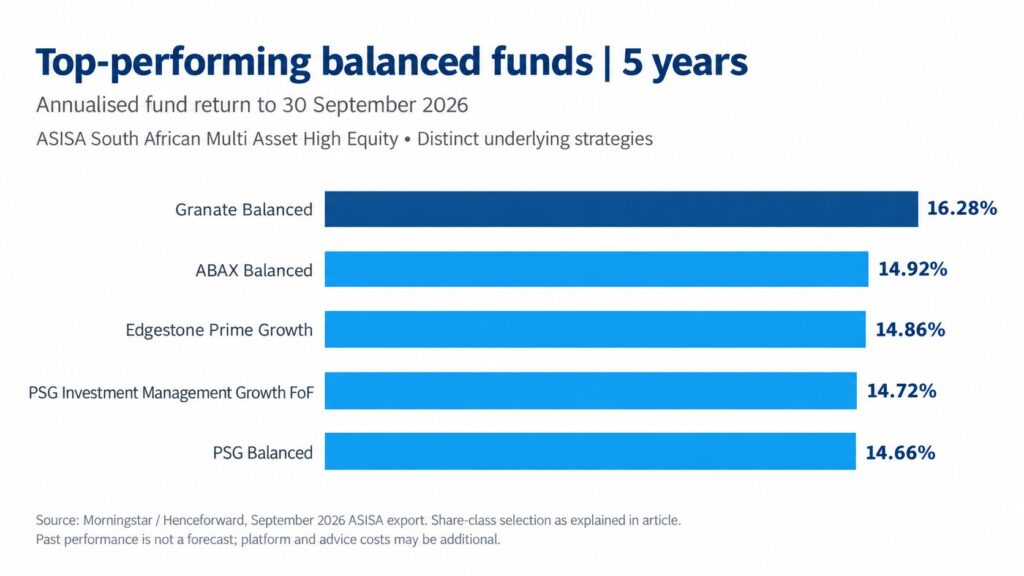
The five-year leaderboard looks different. Granate remains in first place at 16.28% p.a., but ABAX Balanced moves into second in our retail comparison, followed by Edgestone Prime Growth, PSG Investment Management Growth FoF and PSG Balanced.
ABAX demonstrates the share-class problem especially clearly. Cheaper classes occupied Morningstar positions two, three and four over five years. The A1 class used here returned 14.92% p.a. and ranked fifth in the raw 191-class universe. Counting those different classes as separate funds would have made the table less useful.
Five years tells us more about the durability of a strategy than three, but it is still a selected period with a particular starting point. Returns should be considered alongside how much risk was taken and whether the process remains credible.
Top-performing balanced funds over 10 years to 30 September 2026
| De-duplicated rank | Fund | 10-year annualised return | Morningstar peer rank |
|---|---|---|---|
| 1 | ABAX Balanced | 11.40% p.a. | 1 / 136 |
| 2 | Aylett Balanced | 10.65% p.a. | 2 / 136 |
| 3 | ClucasGray Equilibrium | 10.40% p.a. | 3 / 136 |
| 4 | PSG Balanced | 10.37% p.a. | 4 / 136 |
| 5 | Centaur Balanced | 10.35% p.a. | 5 / 136 |
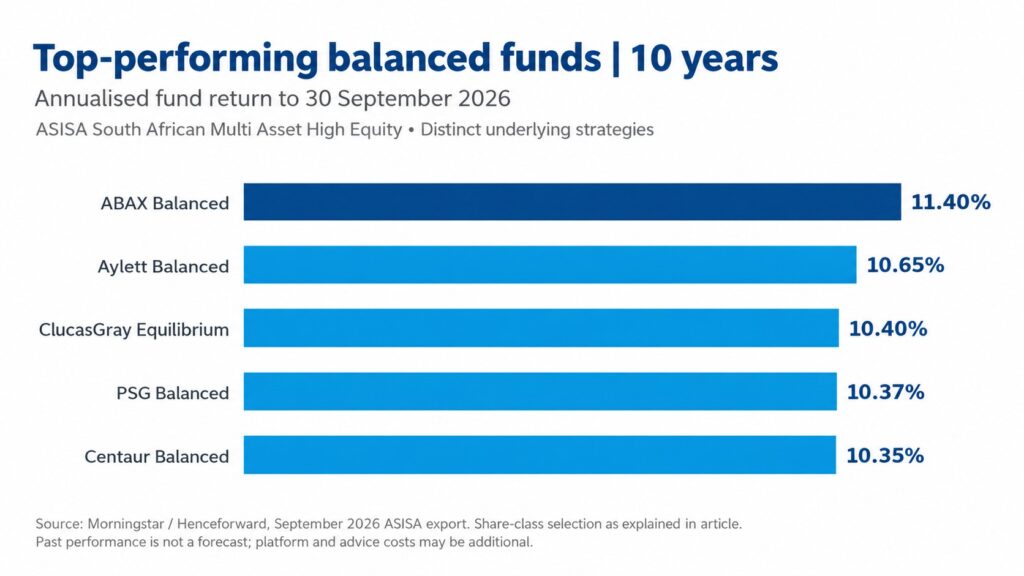
Over ten years, the order changes again. ABAX Balanced A1 returned 11.40% p.a. and ranks third among the full Morningstar share-class universe — but first after our underlying-fund de-duplication and choice of retail class. Aylett Balanced, ClucasGray Equilibrium, PSG Balanced and Centaur Balanced follow.
The less expensive ABAX B3 and B1 classes ranked first and second in the raw export, with higher reported returns than A1. They represent the same underlying fund, not three different long-term winners. The A1 figures are therefore used consistently in this article.
Notice that Aylett’s three-year position is much lower than its ten-year position. A single rolling return window can tell a very different story from a longer one. This is why a list of past leaders should inform due diligence rather than substitute for it.
How passive and core balanced funds compare
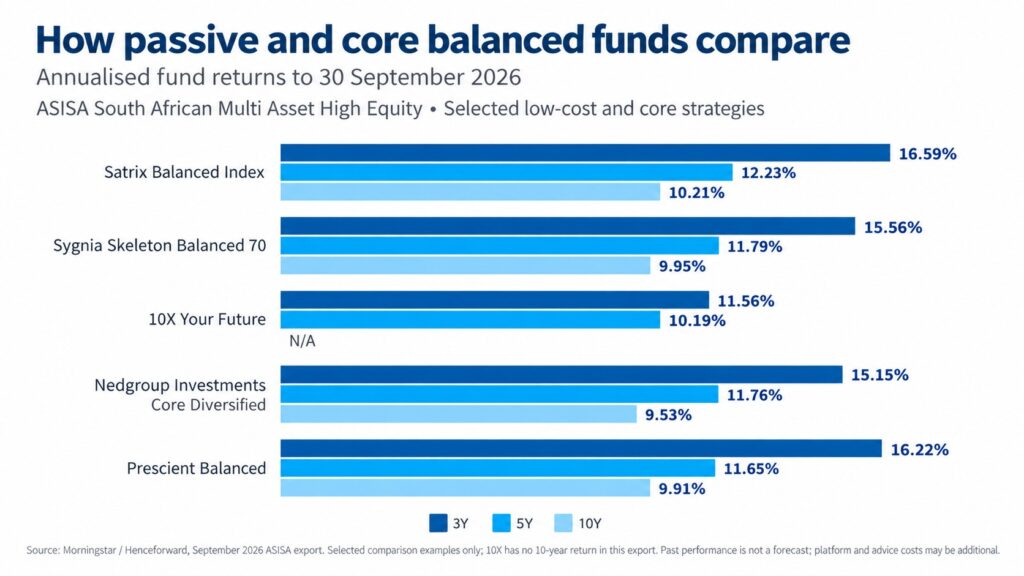
One of the more striking features of the September data is how competitive several low-cost, rules-based and core strategies have been against a substantial active-management universe. These are comparison examples, not a homogeneous set of passive funds.
| Fund | 3 years — return / peer rank | 5 years — return / peer rank | 10 years — return / peer rank |
|---|---|---|---|
| Satrix Balanced Index | 16.59% — 7 / 210 | 12.23% — 19 / 191 | 10.21% — 8 / 136 |
| Sygnia Skeleton Balanced 70 | 15.56% — 21 / 210 | 11.79% — 33 / 191 | 9.95% — 12 / 136 |
| 10X Your Future | 11.56% — 174 / 210 | 10.19% — 124 / 191 | N/A |
| Nedgroup Investments Core Diversified | 15.15% — 36 / 210 | 11.76% — 35 / 191 | 9.53% — 21 / 136 |
| Prescient Balanced | 16.22% — 10 / 210 | 11.65% — 37 / 191 | 9.91% — 13 / 136 |
Satrix Balanced Index ranks 7th / 210 over three years, 19th / 191 over five years and 8th / 136 over ten years, an unusually strong relative profile across the three periods. Prescient Balanced ranks tenth over three years and thirteenth over ten years; Sygnia Skeleton Balanced 70 ranks twelfth over ten years. Nedgroup Core Diversified sits 35th over five years and 21st over ten.
By contrast, 10X Your Future ranks substantially lower within the peer group over the three- and five-year periods shown, and does not have a ten-year return in the September export.
These observations do not prove that passive management always beats active management. They do make it harder to dismiss well-constructed, lower-cost core strategies. The comparison also shows why fees, benchmark exposures, asset allocation and manager-specific risks need to be evaluated together rather than treating any one label as sufficient.
Some well-known active funds in context
Brand recognition and peer-group rank are not interchangeable. The same September 2026 data provides useful context for three established balanced-fund names:
| Fund | 3 years — return / peer rank | 5 years — return / peer rank | 10 years — return / peer rank |
|---|---|---|---|
| Allan Gray Balanced | 14.56% — 56 / 210 | 13.00% — 12 / 191 | 9.45% — 25 / 136 |
| Coronation Balanced Plus | 13.05% — 125 / 210 | 10.13% — 131 / 191 | 8.75% — 49 / 136 |
| Ninety One Opportunity | 10.17% — 197 / 210 | 9.43% — 156 / 191 | 8.46% — 68 / 136 |
Allan Gray Balanced is the strongest of these three by five-year rank, at 12th / 191. Coronation Balanced Plus and Ninety One Opportunity occupy materially lower positions in the three- and five-year comparisons, although their relative positions differ over ten years.
This is not a judgement on the current suitability or future prospects of any manager. It is a reminder that a familiar brand and a recent top-five ranking are both inadequate shortcuts for choosing a long-term investment.
What the performance tables really tell us
1. The same ASISA category contains a wide range of outcomes
Among the selected fund classes discussed here, the three-year annualised returns range from 21.33% for Granate Balanced to 10.17% for Ninety One Opportunity — a difference of about 11.2 percentage points a year over that period. The corresponding five-year examples range from 16.28% to 9.43%, and the ten-year examples from 11.40% to 8.46%.
That difference matters. But we know these historical outcomes only after the fact, and the tables do not identify who will lead next.
2. Leadership changes depending on the period
Granate leads the three- and five-year retail comparisons, while ABAX leads over ten. PSG Balanced appears in both the five- and ten-year top-five lists, but is thirteenth over three years. Aylett, by contrast, is fourth among raw ten-year classes and much further down over three years.
3. Smaller managers deserve investigation, not automatic selection
Several managers near the top are not the household names an investor might expect. That challenges an assumption that the largest provider must have the best investment strategy. Size, capacity, liquidity, business stability, team depth and succession are still relevant due-diligence questions.
4. Cost is consequential, but not the whole answer
Repeatedly paying unnecessary fees creates a compounding drag. The Satrix data demonstrates that lower-cost core approaches can also be highly competitive on reported return. But costs must be weighed against diversification, the investment process, appropriate risk and the total charges actually borne by an investor.
5. Return tables say little about the difficult periods
These tables do not show maximum drawdown, recovery time, downside participation or the consistency of the return. Two funds with similar ten-year returns may have delivered very different experiences — with implications for investor behaviour and retirement risk.
6. Share-class rankings can create false precision
ABAX is a vivid example of one underlying fund appearing in multiple ranking positions. A class-by-class league table is not automatically a league table of different strategies. Always identify the exact class, fees, investor eligibility and measurement period before treating a ranking as meaningful.
How to evaluate funds inside an RA
1. Start with the role of the money
A person accumulating retirement savings over several decades and someone close to retirement face different risks. Time horizon, required return, existing assets, cash-flow needs and capacity for loss should frame the decision.
2. Compare more than one measurement period
Three, five and ten years reveal different things. Shorter periods say more about what has recently worked; longer records may span several market environments. Neither is a stand-alone verdict.
3. Understand the source of performance
Was it asset allocation, equity selection, offshore positioning, currency exposure or a particular investment style? A return becomes more useful evidence when one understands how it was achieved.
4. Evaluate risk alongside return
Consider drawdowns, volatility, concentrations, liquidity and how the fund behaved when markets were under pressure.
5. Include every layer of cost
Fund expenses are not the whole price of an RA. Platform, administration and advice charges can be additional. A realistic comparison looks at the combined cost of owning and maintaining the strategy.
6. Think about manager and style diversification
Using several portfolios can reduce reliance on one investment philosophy, although simply adding more funds does not automatically improve diversification.
7. Consider Regulation 28 and the wider portfolio
Existing employer-fund savings, other retirement capital, discretionary assets, offshore exposure and future income requirements help determine the job the RA should do.
8. Avoid switching just because a rank changes
Ranking changes are prompts for investigation. They are not automatic buy, sell or switch instructions; understanding the underlying reasons matters more than the change in a league-table position.
Where an RA fits into the wider retirement plan
An RA can be an effective retirement-saving structure: qualifying contributions may attract a tax deduction, capital benefits from preservation rules and Regulation 28 provides a prudential framework.
Those advantages do not imply that every spare rand should go into an RA. Planning also requires accessible capital, emergency reserves, discretionary investments, other retirement vehicles and sometimes offshore assets with different liquidity and estate-planning characteristics.
The 45% institutional foreign-exposure prudential limit means that offshore exposure in retirement funds is not unrestricted. Other assets may therefore complement an RA, depending on the overall circumstances. This is a planning decision, not a blanket argument for or against retirement annuities.
At death, retirement-fund benefits are governed by retirement-fund death-benefit provisions rather than simply passing according to a will; beneficiary nominations matter but are not the entire legal process.
The better question is not simply “RA or something else?” It is which structure gives each part of the capital the right role in the bigger plan.
Frequently Asked Questions
What is the best retirement annuity in South Africa?
There is no single retirement annuity that is best for everyone. An RA is a retirement-fund structure containing investments. The appropriate comparison considers the portfolio, charges, risk, liquidity rules, Regulation 28 and the role the RA serves in the wider retirement plan. The September 2026 rankings are historical, not recommendations.
Which balanced fund performed best over three years to September 2026?
Granate Balanced ranked first in the Morningstar South African Multi Asset High Equity class universe over three years to 30 September 2026, returning 21.33% a year. It is a historical peer-group result, not evidence that the same fund will lead in future.
Which balanced fund performed best over ten years?
In our de-duplicated retail-class comparison, ABAX Balanced leads the ten-year table to 30 September 2026 at 11.40% a year using the A1 class, which ranked third in the raw Morningstar universe. Lower-cost ABAX classes took raw ranks one and two, but they are the same underlying fund.
Are passive balanced funds competitive with active funds?
Several have been. Satrix Balanced Index ranked 7th out of 210 over three years, 19th out of 191 over five years and 8th out of 136 over ten years to 30 September 2026. That is strong historical peer performance, but it does not guarantee future results or resolve suitability for a particular investor.
How much can I deduct for retirement annuity contributions in 2026?
For the 2026/27 tax year, qualifying retirement-fund contributions are generally deductible up to 27.5% of the greater of remuneration or taxable income, subject to an overall R430,000 cap and the detailed section 11F calculation. This limit applies across pension, provident and retirement annuity contributions rather than separately to each account.
The bottom line: use performance as evidence, not as a shopping list
The September 2026 data confirms that fund selection can make a material difference to historical returns within the same broad ASISA category. Smaller managers have been competitive, and lower-cost core strategies — Satrix Balanced Index in particular — compare remarkably well over several periods.
It also shows the limits of a league table. Leadership changes with the period. Share classes can make the same fund appear multiple times. The tables do not adequately describe risk, and none can tell us who will lead next.
A retirement annuity remains one component of a retirement plan. A better decision considers whether the structure, underlying investments, costs and risks help the retirement capital perform its intended role over the relevant time horizon.
For the broader context, see our retirement planning guide for South Africans.
If you are reviewing an existing retirement annuity, the useful starting point is not simply whether another fund has recently performed better. We can help you assess the investments, overall costs, tax structure and wider retirement plan together. We typically work with clients with investable assets upwards of R10m for our flat fee holsitic planning and service model to demonstrate real value.
This article is for general information and education only and does not constitute personal financial advice or a recommendation to invest in any named fund.
Past performance is not indicative of future results. Returns and ranks are sourced from the Morningstar report, South African Multi Asset High Equity category, with performance periods ending 30 September 2026. Returns for periods longer than one year are annualised; the selected South African fund classes report in rand. Results reflect the stated fund unit/share classes and are not adjusted for any particular investor’s cash flows, tax, additional platform, administration or advice charges. Rankings may differ by fee class, and funds may not be available through every retirement annuity provider.
Tax and retirement-fund rules may change. Personal tax, legal and retirement decisions require current verification and, where appropriate, specialist advice.
Henceforward (Pty) Ltd is an authorised representative of Graviton Wealth Management (Pty) Ltd, FSP 8772.

Carl-Peter has worked in financial services since 2003 and co-founded Henceforward with Steven Hall. His work includes investment strategy, portfolio construction and retirement planning.